
GraphCrunch 2:
Software tool for network modeling, alignment and clustering

|
GraphCrunch 2:
|
|
Oleksii Kuchaiev, Aleksandar Stevanovic, Wayne Hayes, Natasa Przulj |
GraphCrunch 2 is a new version of our GraphCrunch software tool for network analysis, modeling and alignment. It automates tasks of finding the best fitting model for the network data, pairwise comparisons of networks, alignment of two networks using GRAAL algorithm (a better network alignment algorithm, MI-GRAAL, is also available for download), and provides capabilities of clustering network nodes based on their topological surrounding in the network. Furthermore, GraphCrunch 2 is highly efficient in computing these tasks, utilizing a parallelization architecture to speed up computations by running tasks in parallel using all available cores and processors in the computer.
Designed with a user friendly, easy and intuitive drag and drop interface, GraphCrunch 2 allows users previously unfamiliar with GraphCrunch to quickly become proficient with typical use case scenarios.
GraphCrunch 2 allows users to stop and resume long computations, provides for reuse of previously computed results without recomputing them again and even recover from hardware malfunctions/execution interruptions without any loss of data or any unnecessary recomputations of previously finished tasks.
For more detailed description of GraphCrunch 2 and its capabilities, see the BMC Bioinformatics paper.
Update : The results presented in Figure 2 of the BMC Bioinformatics paper are slightly affected from the update in version 2.1. Figure 2 presented in the paper is updated as below:
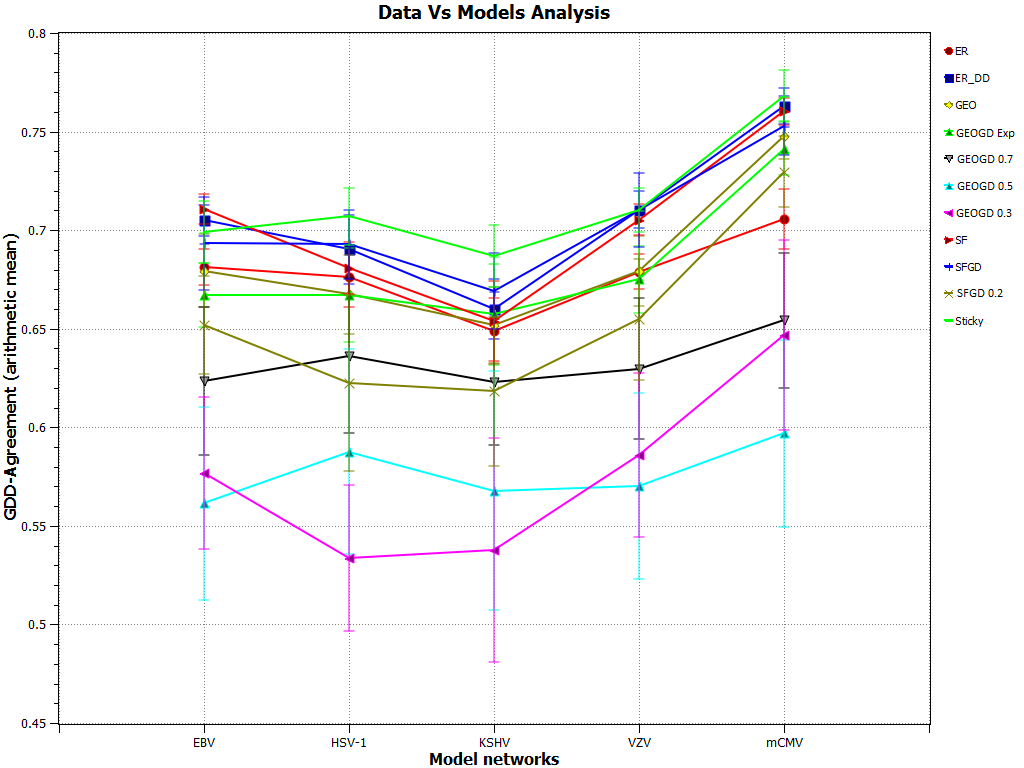
GDD-agreement between the viral PPI networks and the model networks. GDD-agreement between the viral PPI networks and the model networks. Points on the horizontal axis correspond to viral PPI networks of: EBV, HSV-1, KSHV, mCMV, and VZV herpes viruses. Lines with different labels correspond to different model networks. The vertical axis represents the average GDD-agreement between the corresponding data and model networks. For each data network, we generated 30 network model instances, each constrained to be of the size of the data. The plot reports the averaged the GDD-agreement values and standard deviations of their GDD-agreement with the data. Higher values of GDD-agreement reflect higher similarities between the networks. This plot was generated by GraphCrunch 2.1.1.