

|
Equator/MIAS Escience Demonstrator Project |
Medical Imaging on the ReaCTor: an E-Science Demonstrator
Visualisation of 3D medical image volumes of the human brain is an important issue for diagnosis of pathologies and pre-surgical planning as well as basic understanding of anatomy. The development of effective visualisation tools is hard enough for standard imaging data, such as MR and PET measurements, but has become critical with the introduction of new modalities such as diffusion, perfusion, functional and permeability imaging, in which considerably more information is gathered. In diffusion imaging, for example, the measurement acquired at each voxel in the image is a complex shape describing the local connectivity of tissue, which is particularly useful in the brain, [Pierpaoli, et al, Diffuse Tensor Imaging of the Human Brain, Radiology, 1996]. At UCL-CS, we have developed interactive immersive visualisation tools for this type of data. One example view from this system can be seen in Figure 1.

Figure 1: User re-configuring the visualisation within the ReaCTor The demonstration uses the UCL ReaCTor, an Immersive Projection Technology (IPT) system similar to a CAVE(tm). The ReaCTor is powered by an SGI Onyx2 with four Infinite Reality2 pipes and 8 processors. The ReaCTor is a four-sided device, with three walls and a floor. The 3D voxel data is presented in head-tracked stereo in real-time and the immersed user is provided with a variety of configuration and exploration tools. The user can collaborate with a colleague on another facility, either another IPT or a desktop system. We have built and tested clients for SGI and Microsoft Windows and have run network trials within UCL and between the UCL ReaCTor and the University of Reading ReaCTor.
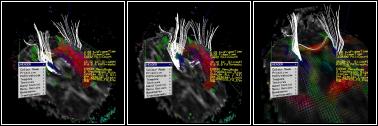
Figure 2-4: Desktop Version
The example data set shown in Figure 1 is a diffusion-weighted MRI scan comprising a 128x128x42 voxel space with each voxel representing 1.7x1.7x2.5mm. The visualisation comprises three main parts: textured cut-planes showing the raw data set; arrays of polyhedra, coloured by the degree of anisotropy and directed by the principle component of the diffusion tensor; and 3D tracks extracted by tracking neuronal fibre pathways through the voxel space [Conturo, et al, Tracking Neuronal Fiber Pathways in the Living Human Brain, Proc. Natl. Acad. Sci. USA, Vol 96, pp 10422-10427]. Tracks are computed using either matrix or eigenvector interpolation of the data set [Kindlmann, et al, Strategies for Direct Volume Rendering of Diffusion Tensor Fields, IEEE Transactions on Visualization and Computer Graphics, 6(2)]. This is done remotely on a Beowulf cluster. We are currently using 72 nodes of a 256-node cluster within the department. The users can interactively select 3D regions from which seed points are extracted and sent to the Beowulf for path extraction. This is parallel process that can start to return results within a few hundred ms. A selection region might result in 3-4000 tracks which would take about five seconds to compute in total. This is an early stage demonstrator, but it is already providing a platform for novel medical imaging work. For example, this is the first demonstration, that we know of, that can compute connectivity between two regions using tractography. We have started evaluating the visualisation itself with colleagues from neuro-science. Under the Equator project we will also do studies of how users actually collaborate in the shared space, following up previous work on the asymmetries in IPT to desktop interaction [Steed, et al., Solving a 3D Cube Puzzle in a Collaborative Virtual Environment: As Good as Really Being There Together?, Technical Sketch, ACM SIGGRAPH 2001].
Figure 5-8: The Authors Other Media |
||||