Provided programs are bigger than some problem and fitness level dependent
threshold,
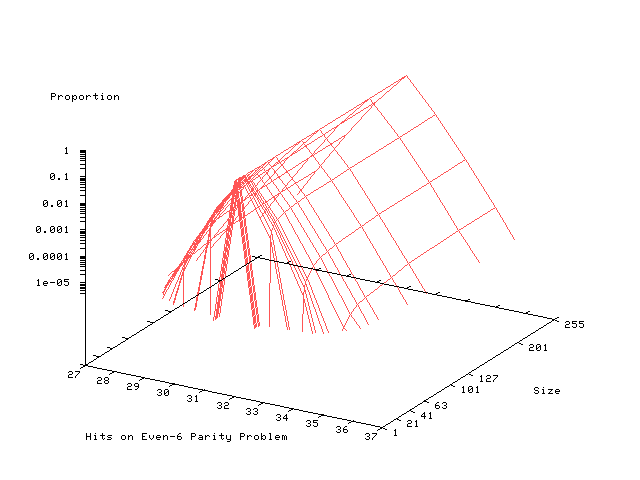
the distribution of their fitness values
in the GP search space
does not change with length
[].
Figure 1 shows an example distribution
of fitness against size.
Note as size increases
the lines tend to lie parallel to the y-axis,
indicating little dependence upon size.
Thus the number of programs with a given fitness is
distributed like the total number of programs.
The number of programs rises
approximately exponentially
with program length.
Also most programs have a maximum depth
near
![]() (ignoring terms O(N1/4) [Flajolet and
Oldyzko1982].
See dashed parabola line on Figure 2.
(ignoring terms O(N1/4) [Flajolet and
Oldyzko1982].
See dashed parabola line on Figure 2.