In all runs most new generations do not find better programs and changes in size and shape are due to bloat. Figure 6 shows, while there is variation between runs, on average each population evolves to lie close to the ridge and moves along it, as predicted.
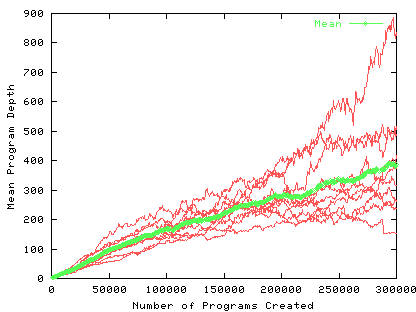
Figure 7 shows the average population depth varies widely between runs, as with the continuous problem, and in several runs the mean depth does not increase uniformly at a constant rate. However the mean of all ten runs is better behaved and increases at about 0.6 levels per generation.
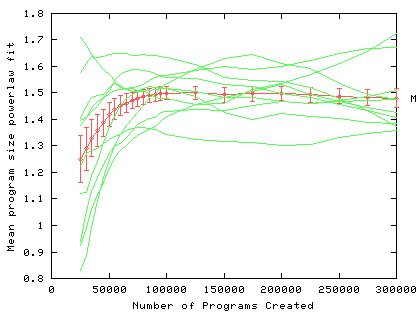
Figure 8 shows the coefficient obtained by fitting a power law to the mean size of programs. Again there is wide variation between runs, however on average the exponents start at 1.25 (generations 12-50) and rise. E.g. between generations 12 and 100 it has reached 1.4. By the end of the runs (generations 12-600) it reaches 1.5. This is approximately the same as for 6 multiplexor with the traditional, multi-arity, function set [Langdon2000].