From Fig. 2 we can see even the highest plagiarism penalty has only a little depressing effect on the maximum score in the population. Surprisingly the effect on the average program score is more obvious. Suppressing programs which copy their parents appears to considerably reduce the proportion of the best program to the rest of the population, thereby increasing the gap between the mean and maximum raw score. As expected, once the rate of finding higher scoring programs drops (about generation 20) the size of programs increases and the population bloats, cf. Fig. 4. The plagiarism penalty is unable to prevent this but appears to slow growth, in that when the penalty is 50% or more, by the end of the run programs are on average only half the size of those created in runs with lower penalties.
As expected near the end of runs with low penalty the maximum score in the population remains fixed for many generations. In contrast at the ends of runs with high penalties it varies rapidly. (It changes (either increases or decreases) on average 4.4 times in the last ten generations with a penalty of 100% and only increases once in the time period in the ten runs with no penalty. This difference is not obvious in Fig. 2 as it plots data averaged over all ten runs).
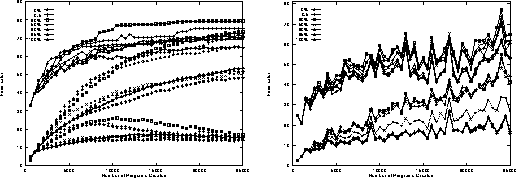
Figure 3:
Evolution of maximum and population mean of food eaten
on random trails
as plagiarism penalty is increased.
Means of 50 runs.
Figure 2:
Evolution of maximum, population mean and standard deviation of food eaten
on Santa Fe trail
as plagiarism penalty is increased.
Means of 10 runs.
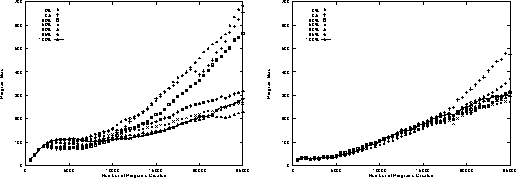
Figure 5:
Evolution of population mean program size
on random trails
as plagiarism penalty is increased.
Means of 50 runs.
Figure 4:
Evolution of population mean program size
on Santa Fe trail
as plagiarism penalty is increased.
Means of 10 runs.
When GP is primarily exploiting the solutions it has found (i.e. the population contains many copies of the same or similar programs) on average only a few individuals need be created before one has the best fitness. (They are distributed independently at random). However if there is a unique best in the population, on average pop size/2 individuals will have to be processed before it is created. Figure 6 shows with low penalties, the population converges, in the sense one of the best programs is created quickly. (This implies there are many such programs). In contrast runs with penalties of 20% or more don't appear to converge like this and about 200 individuals are created before one with the highest fitness in that generation. This indicates there are only 1 or 2 ``best'' programs per population.
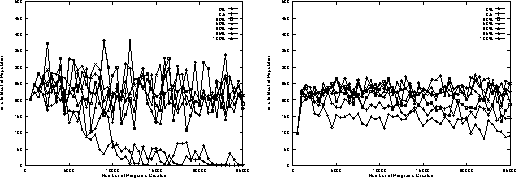
Figure 7:
Evolution of number of location of ``best'' program in each population
on random trails
as plagiarism penalty is increased.
Means of 50 runs.
Figure 6:
Evolution of number of location of ``best'' program in each population
on Santa Fe trail
as plagiarism penalty is increased.
Means of 10 runs.
Further evidence for the lack of convergence is contained in Fig. 8 which indicates where the penalty is low the population evolves so that it is quickly dominated by programs which have the same score as their first parent. While with a high penalty this fraction of the programs increases only slightly and remains near its value in the first few generations. Note this convergence is not the same as convergence in linear genetic algorithms, the population variety is high. Without a plagiarism penalty the fraction of different programs in the population rises to lie near 99% by the end of the run. While with a plagiarism penalty of 50% or more it is still high and reaches about 95% by generation 50. (The slight difference between these figures may be simply due to the larger size of programs when the penalty is low, cf. Fig. 4).
Studying the successful crossovers, i.e. those that produced offspring which cause more food to be eaten than their (first) parent, shows runs without a penalty converge in that crossover seldom makes improvement after generation 10 (in the ten run there were only 40 improvements after generation 25, compared to a total of 3,451). Whereas with a 100% penalty the population remains ``on the boil'' with parents of lower score being selected and crossover continuing to make improvements on them until the end of the run. (E.g. In the first run with a 100% penalty there were 3,098 such crossovers, about 1,730 after generation 25).
Another aspect of the convergence of runs with low penalties is individuals with the same score are selected to be parents. E.g. at the end of all but one run with no penalty, all parents had identical scores. With high penalties there is more variation (on average 29.7 different scores acting as first parents to children in the final population of runs with a 100% penalty).
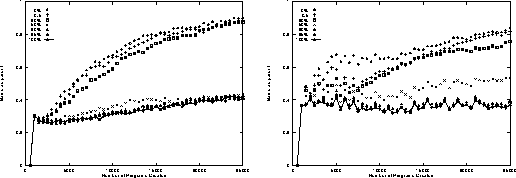
Figure 9:
Evolution of proportion of population with same score as first parent
on random trails
as plagiarism penalty is increased.
Means of 50 runs.
Figure 8:
Evolution of proportion of population with same score as first parent
on Santa Fe trail
as plagiarism penalty is increased.
Means of 10 runs.