In 50 independent runs 6 found ants that could eat all the food on the Santa Fe trail within 600 time steps. The evolution of maximum and mean fitness averaged across all 50 runs is given in Figure 1. (In all cases the average minimum fitness is near zero). These curves show the GP fitness behaving as expected with both the maximum and average fitness rising rapidly initially but then rising more slowly later in the runs. The GP population converges in the sense that the average fitness approaches the maximum fitness. However the spread of fitness values of the children produced in each generation remains large and children which eat either no food or only one food unit are still produced even in the last generation.
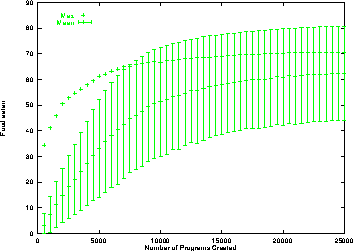
Figure 1:
Evolution of maximum and population mean of food eaten.
Error bars indicate one standard deviation.
Means of 50 runs.
Figure 2 shows the evolution of maximum and mean program size averaged across all 50 runs. We see in the first four generations the average program length grows rapidly from an initial size of 23.5 to 73.5. Program size remains fairly static from generation 4 to generation 11, when it begins to grow progressively towards the maximum allowed program size of 500.
Surprisingly the mean program length grows faster than the size of the best program within the population and between generations 2 and 12 it exceeds it (cf. Section 5.1.1). In the later generations the mean program length and length of the best program on average lie close to each other. The size of the best program refers to that of a single individual. In generations with more than one individual program having the top score, one such program is chosen at random and labelled the ``best''. This random choice leads to random fluctuations in apparent program size which can be seen in Figure 2 after generation 27 despite averaging over 50 runs.

Figure 2:
Evolution of maximum and population mean program length.
Error bars indicate one standard deviation.
Solid line is the length of the ``best'' program in the population.
Covariance of length and normalised rank based fitness,
and effect of size limit
shown dotted.
Means of 50 runs.