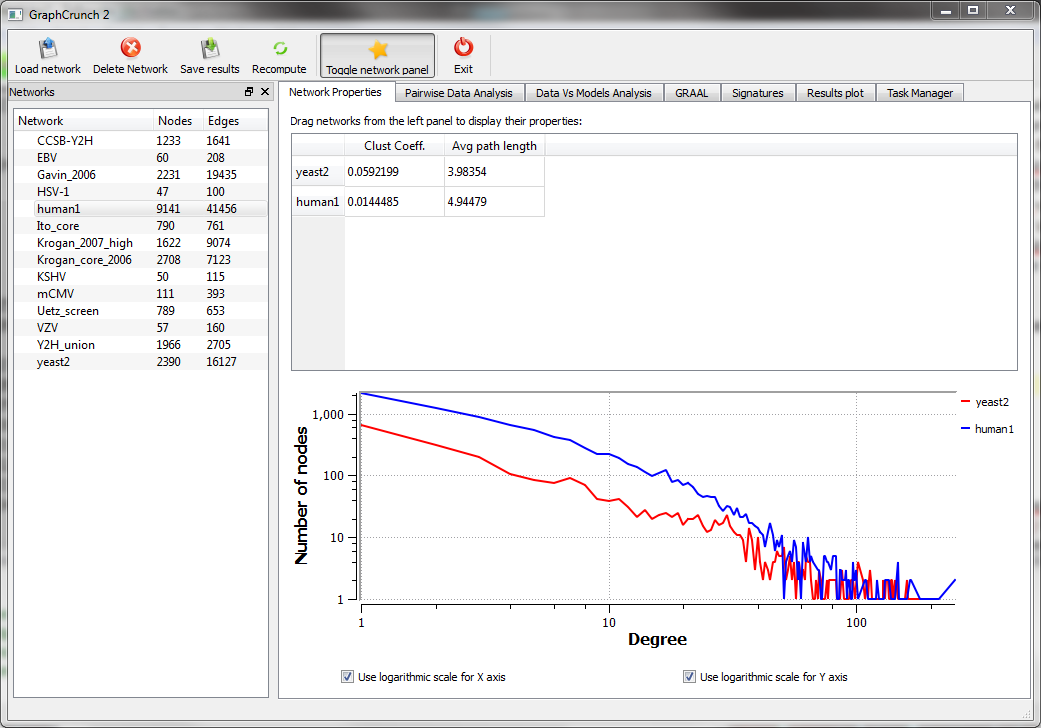
| Example of computing network
properties for 2 networks, yeast2 and human1, displaying their
clustering coefficient, average path length and degree distribution in
log-log scale. |
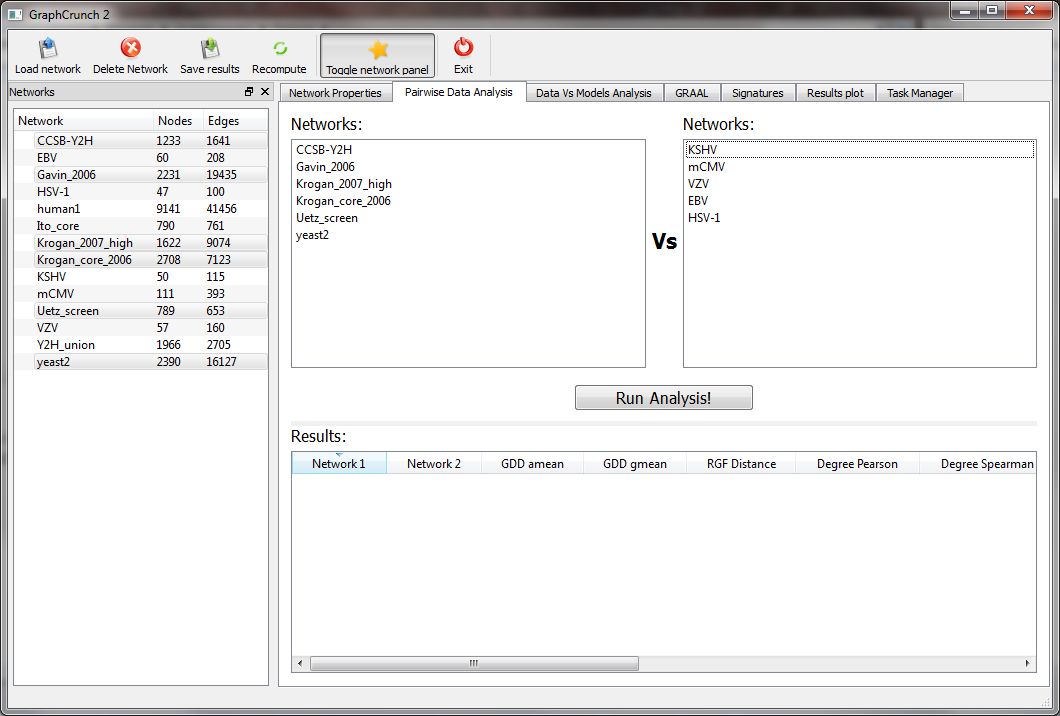
Pairwise data analysis
screen, showing the initial selection of two network groups
scheduled to be compared to each other. |
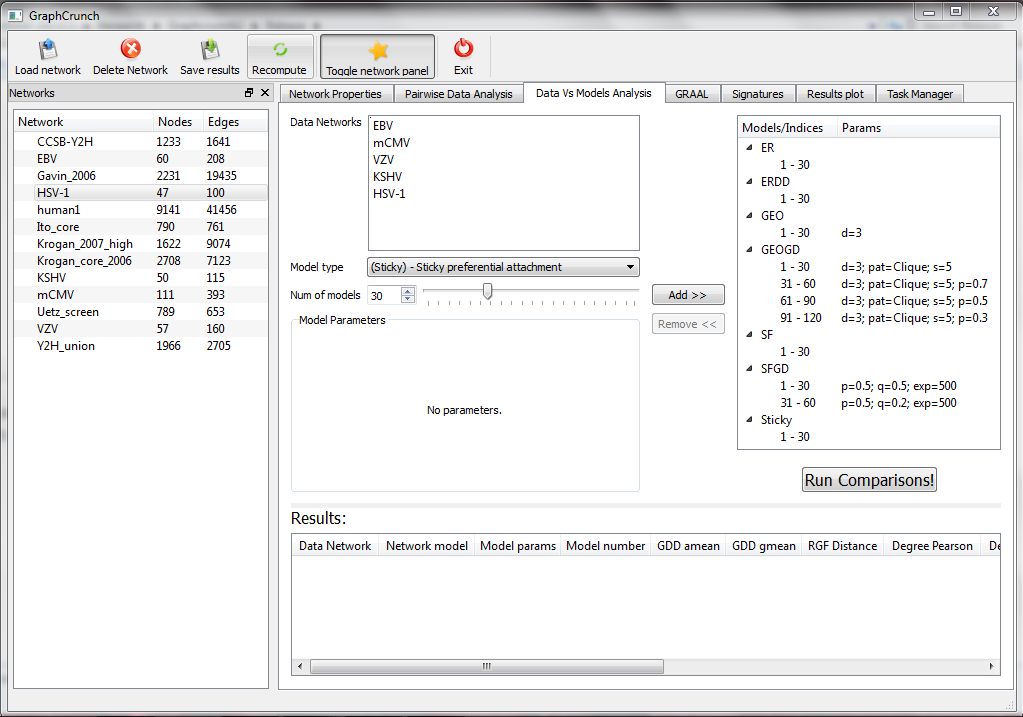
Example of Data Vs Models Analysis
scheduling window, displaying a selection 5 virus networks
scheduled to be compared to 11 different model types each
generating 30 model instances. |
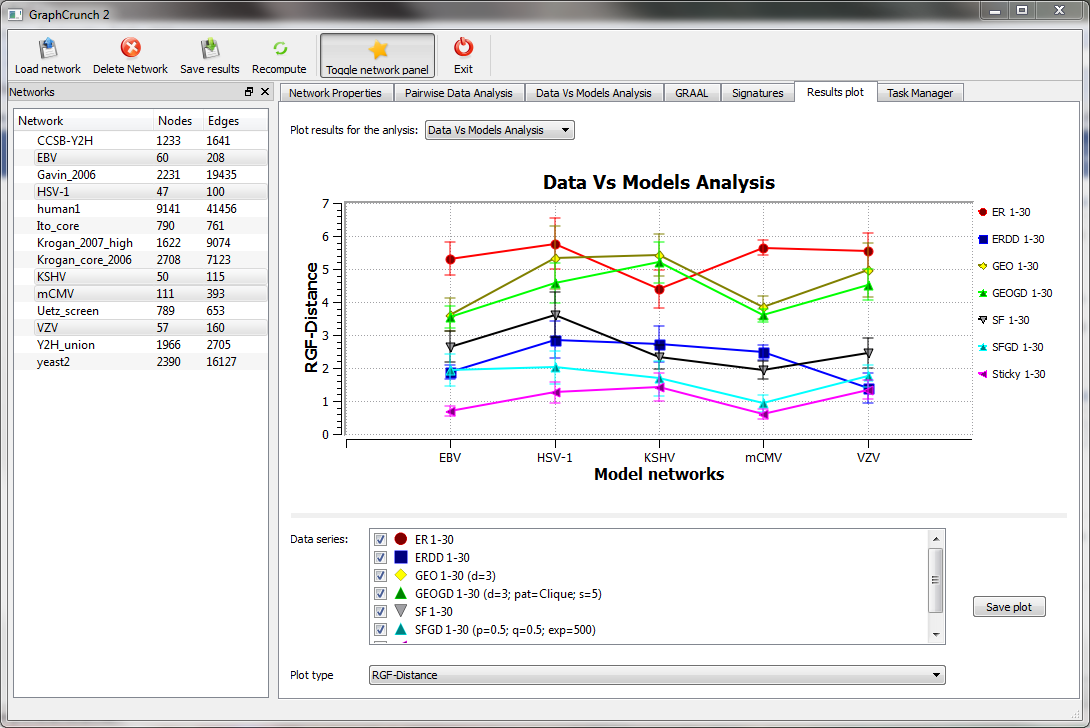
| Graphic plot of the results for
the
virus data vs model analysis, displaying RGF distance for selected
subset of models. |
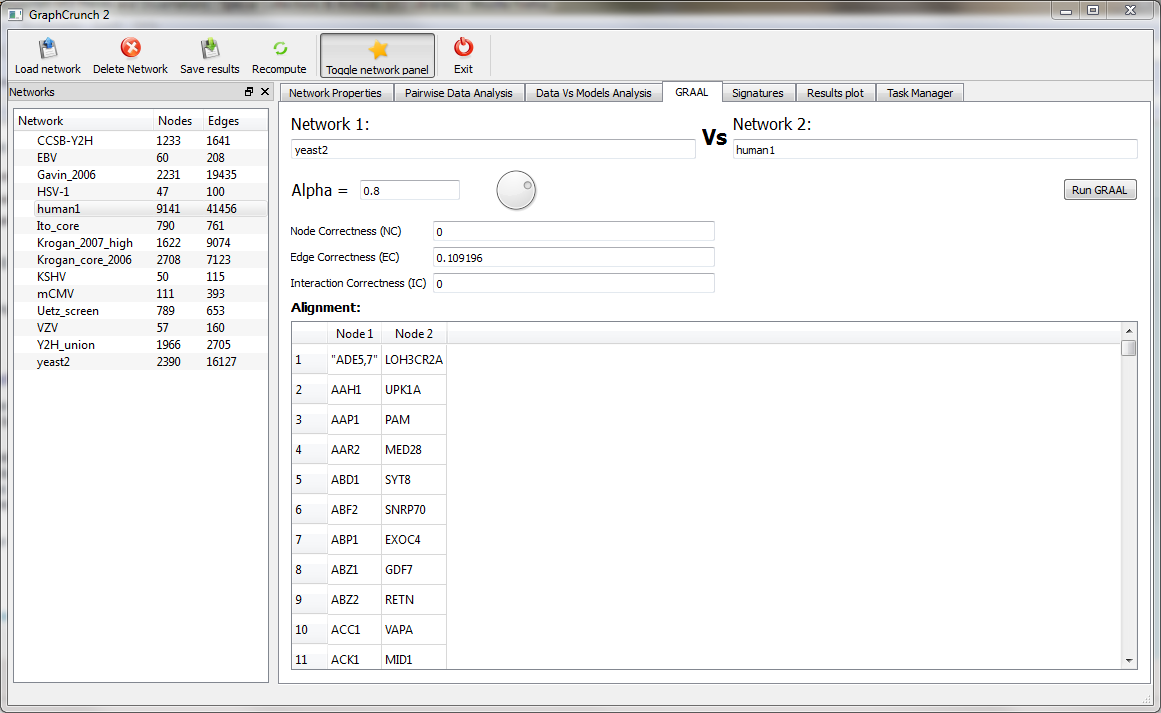
Example of GRAAL topological
allignment between 2 networks, yeast2 and human1 and their
coresponding node alignment. |
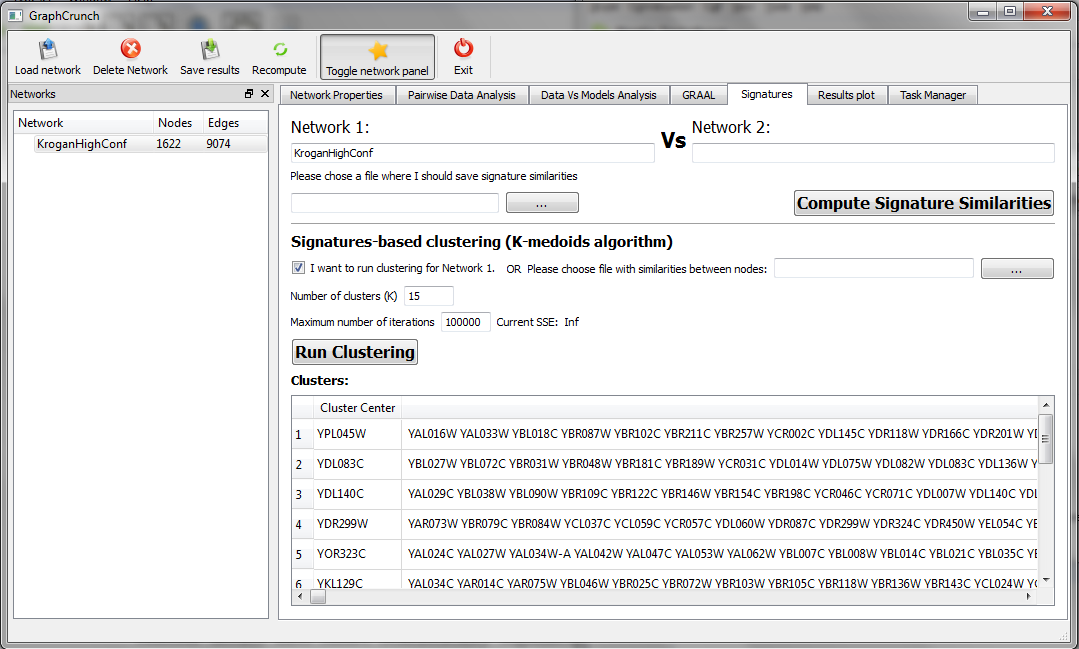
Example of signature
similarities based clustering, run on previously computed Krogan High
confidence signature similarities for K=15 clusters. |