Image illustrating how gene components work together
As these chips are thought to record the activity of almost all human genes, investigations into the behaviour not just of individual genes but also of gene components can begin.
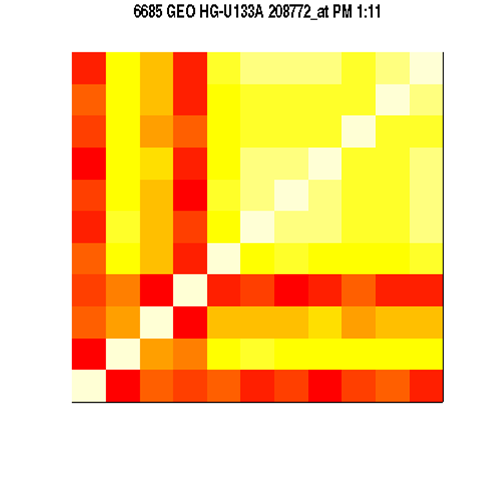
As an example of a GeneChip, the image here show the cross correlation between 11 measurements of a human gene which regulates the activity of other genes. The 11 measurement points are placed in order along the gene. Yellow indicates highly correlated pairs of measurements while red is low (or even negative) correlation. The picture makes it clear that this gene is not acting as a single whole but instead subregions in the gene can be clearly seen.
The Bioinformatics Group has produced
many of these heatmaps, showing a wide
range of different behaviours, some
expected and some new. Many more
examples can be found at:
http://bslin11ha/users/wlangdon/HG-U133A/