GraphCrunch
A Tool for Large Network Analyses
___________________________________________________________________
Examples of visualized output
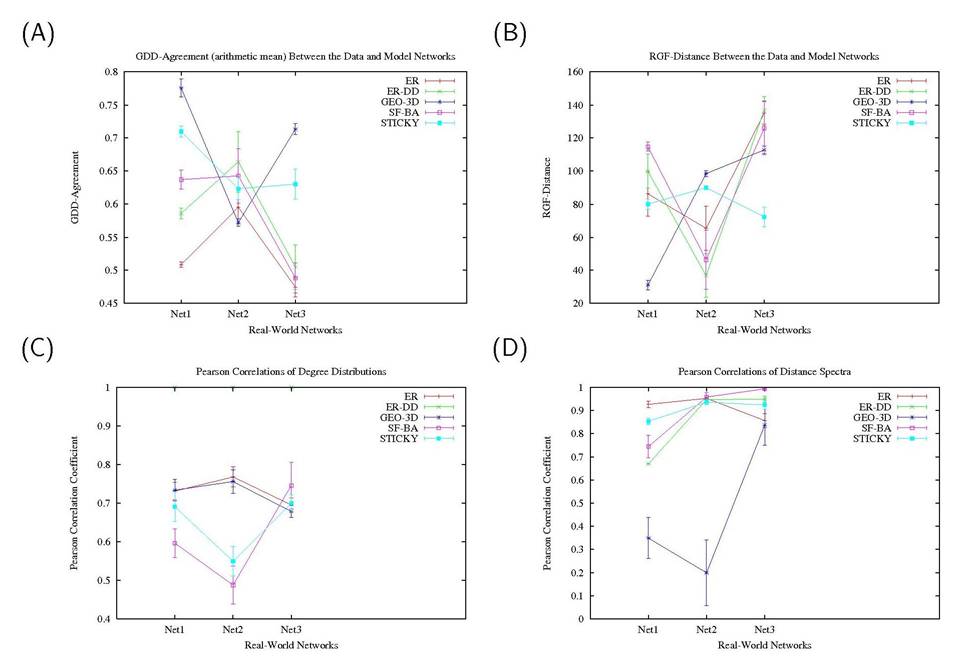
Figure: Examples of plots that illustrate the fit of five network models (ER, ER-DD, GEO-3D, SF-BA, and STICKY) to three data sets (Net1, Net2 and Net3) with respect to four networks properties: (A) GDD-agreement, (B) RGF-distance, (C) the degree distribution, and (D) the distance spectrum. Each point in each of the panels represents the average of the fit of the real-world and model networks with respect to the given property (over model networks belonging to the same random graph model corresponding to the real-world network); the error bars represent one standard deviation above and below the average.
___________________________________________________________________