close all; clear; clc
Ns = 10;
Nv = 10*10*10;
randn('state', 0);
tol = 1e-12;
f = figure;
set(f,'Position', [60, 60, 800, 600]);
p = 1;
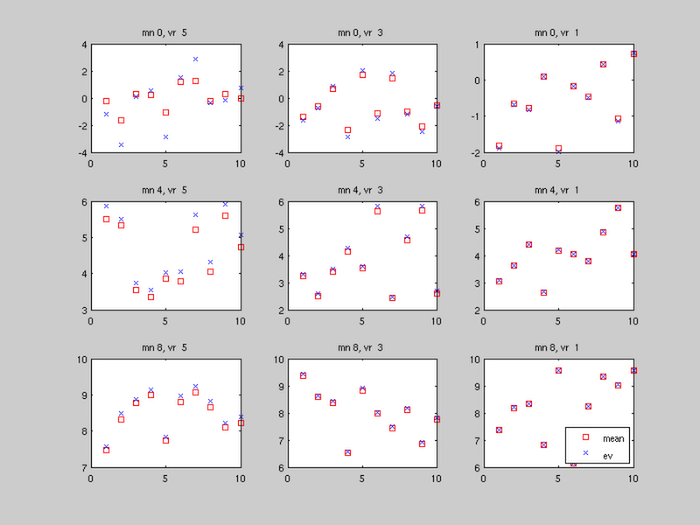
for mn = [0 4 8]
for vr = [5 3 1]
y = mn + randn(Ns, 1);
y = repmat(y, 1, Nv) + vr*randn(Ns, Nv);
m = mean(y, 2);
[V E] = eig(y*y');
[mx ix] = max(diag(E));
Vev = V(:, ix);
Vev = Vev * sign(sum(y'*Vev)+eps);
Vsc = Vev * sqrt(mx / Nv);
[u s u] = svd(spm_atranspa(y'));
s = diag(s);
u = u(:, 1);
u = u * sign(sum(y'*u));
Y = u * sqrt(s(1)/Nv);
if max(abs(Y-Vsc)) > tol; keyboard; end
subplot(3, 3, p)
plot(1:Ns,m,'rs', 1:Ns,Y,'bx')
title(sprintf('mn %g, vr %2.2g', mn, vr))
p = p + 1;
end
end
legend('mean', 'ev', 'Location','SouthEast')