- Abstract
In this work, we return to the underlying mathematical definition of a manifold and directly characterise learning a manifold as finding an atlas, or a set of overlapping charts, that accurately describe local structure. We formulate the problem of learning the manifold as an optimisation that simultaneously refines the continuous parameters defining the charts, and the discrete assignment of points to charts.
In contrast to existing methods, this direct formulation of a manifold does not require “unwrapping” the manifold into a lower dimensional space and allows us to learn closed manifolds of interest to vision, such as those corresponding to gait cycles or camera pose. We report state-ofthe-art results for manifold based nearest neighbour classification on vision datasets, and show how the same techniques can be applied to the 3D reconstruction of human motion from a single image.
- Method Overview
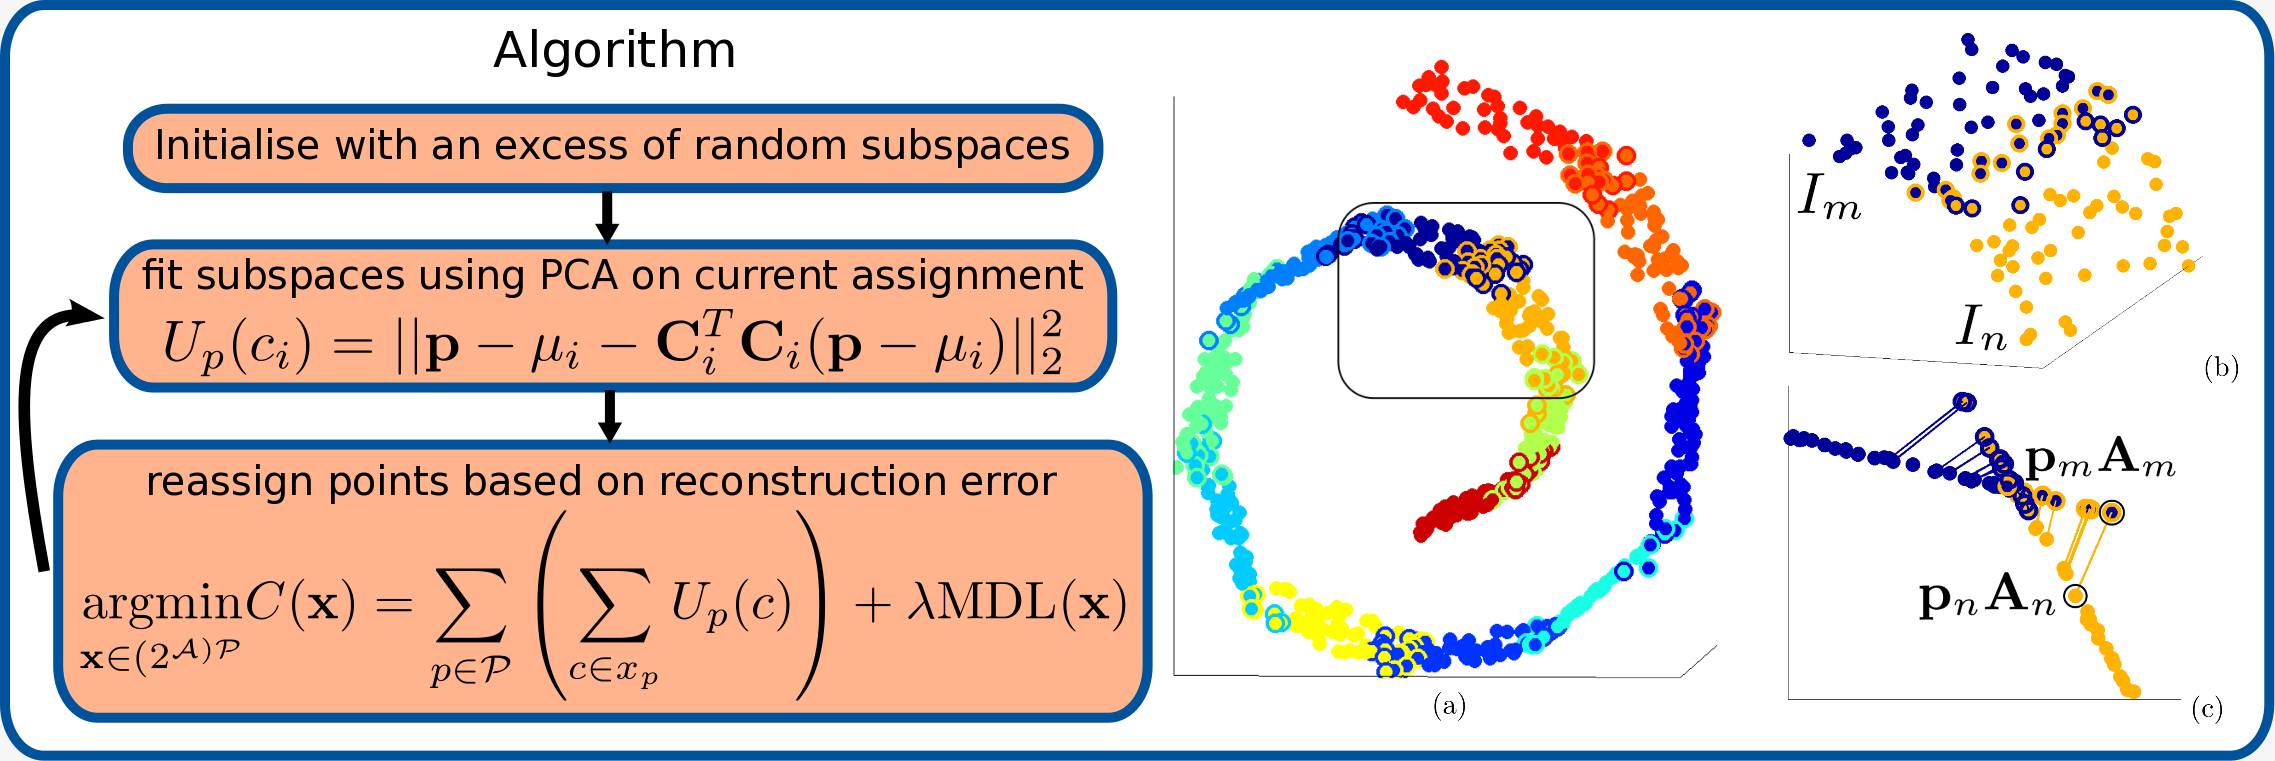
Left: Simultaneous optimisation of subspace fitting and point assignment. Right: A manifold as overlapping charts. (a) shows a typical decomposition into overlapping charts. A point’s assignment to the interior of a chart is indicated by its colour. Membership of additional charts is indicated by a ring drawn around the point. (b) shows a detail of two overlapping charts. (c) shows a side view of the projected locations of the same point by different charts.

- Manifold Unwrapping
Unwrapping a Manifold Top row: (a) The original data; (b) the unwrapping generated by Atlas; (c) the charts found by Atlas; (d) the charts unwrapped. Other rows: (e-l) Other methods. All methods shown with optimal parameters. Left: Swiss Roll with Gaussian noise. Right: Sharply peaked Gaussian manifold with no noise. Additional examples in supplementary materials PDF.

- Face Recognition
Yale Faces classification error (%) using 1-NN. The classification error of 1-NN in the original space is 4.39, and the lowest classification error of PCA 1-NN is 4.02 for d = 292. #c is the number of charts found by Atlas(+). For LTSA and LLE, k ∈ [2, 20]. SMCE uses λ ∈ [1, 100] . For Atlas, λ = 700 and k = 4. For Atlas+, λ = 700, k = 2, and the pairwise terms use 5 neighbours with θ = 1000.

- Handwritten Digit Recognition
Semeion dataset classification error (%) of 1-NN classifier with PCA, LLE, LTSA, Atlas, and wLTSA. The classification error of 1-NN classifier in the original space is 10.92 with 10.90 reported in [25]. #c denotes the number of charts found by Atlas. Left: Columns 3, 4, and 5 contain the results reported in [25]. The best value of k ∈ {10, 15, 20, 25} for LLE and k ∈ {35, 40, 45, 50} for LTSA and wLTSA; For Atlas, λ = 100 and k = 6. Right: Semeion dataset classification error (%) of NN classifier with PCA, LLE, LTSA, and Atlas. The best value of k ∈ [2, 50] for LLE and LTSA. For Atlas, λ = 100 and k = 6.

- Human Motion Reconstruction
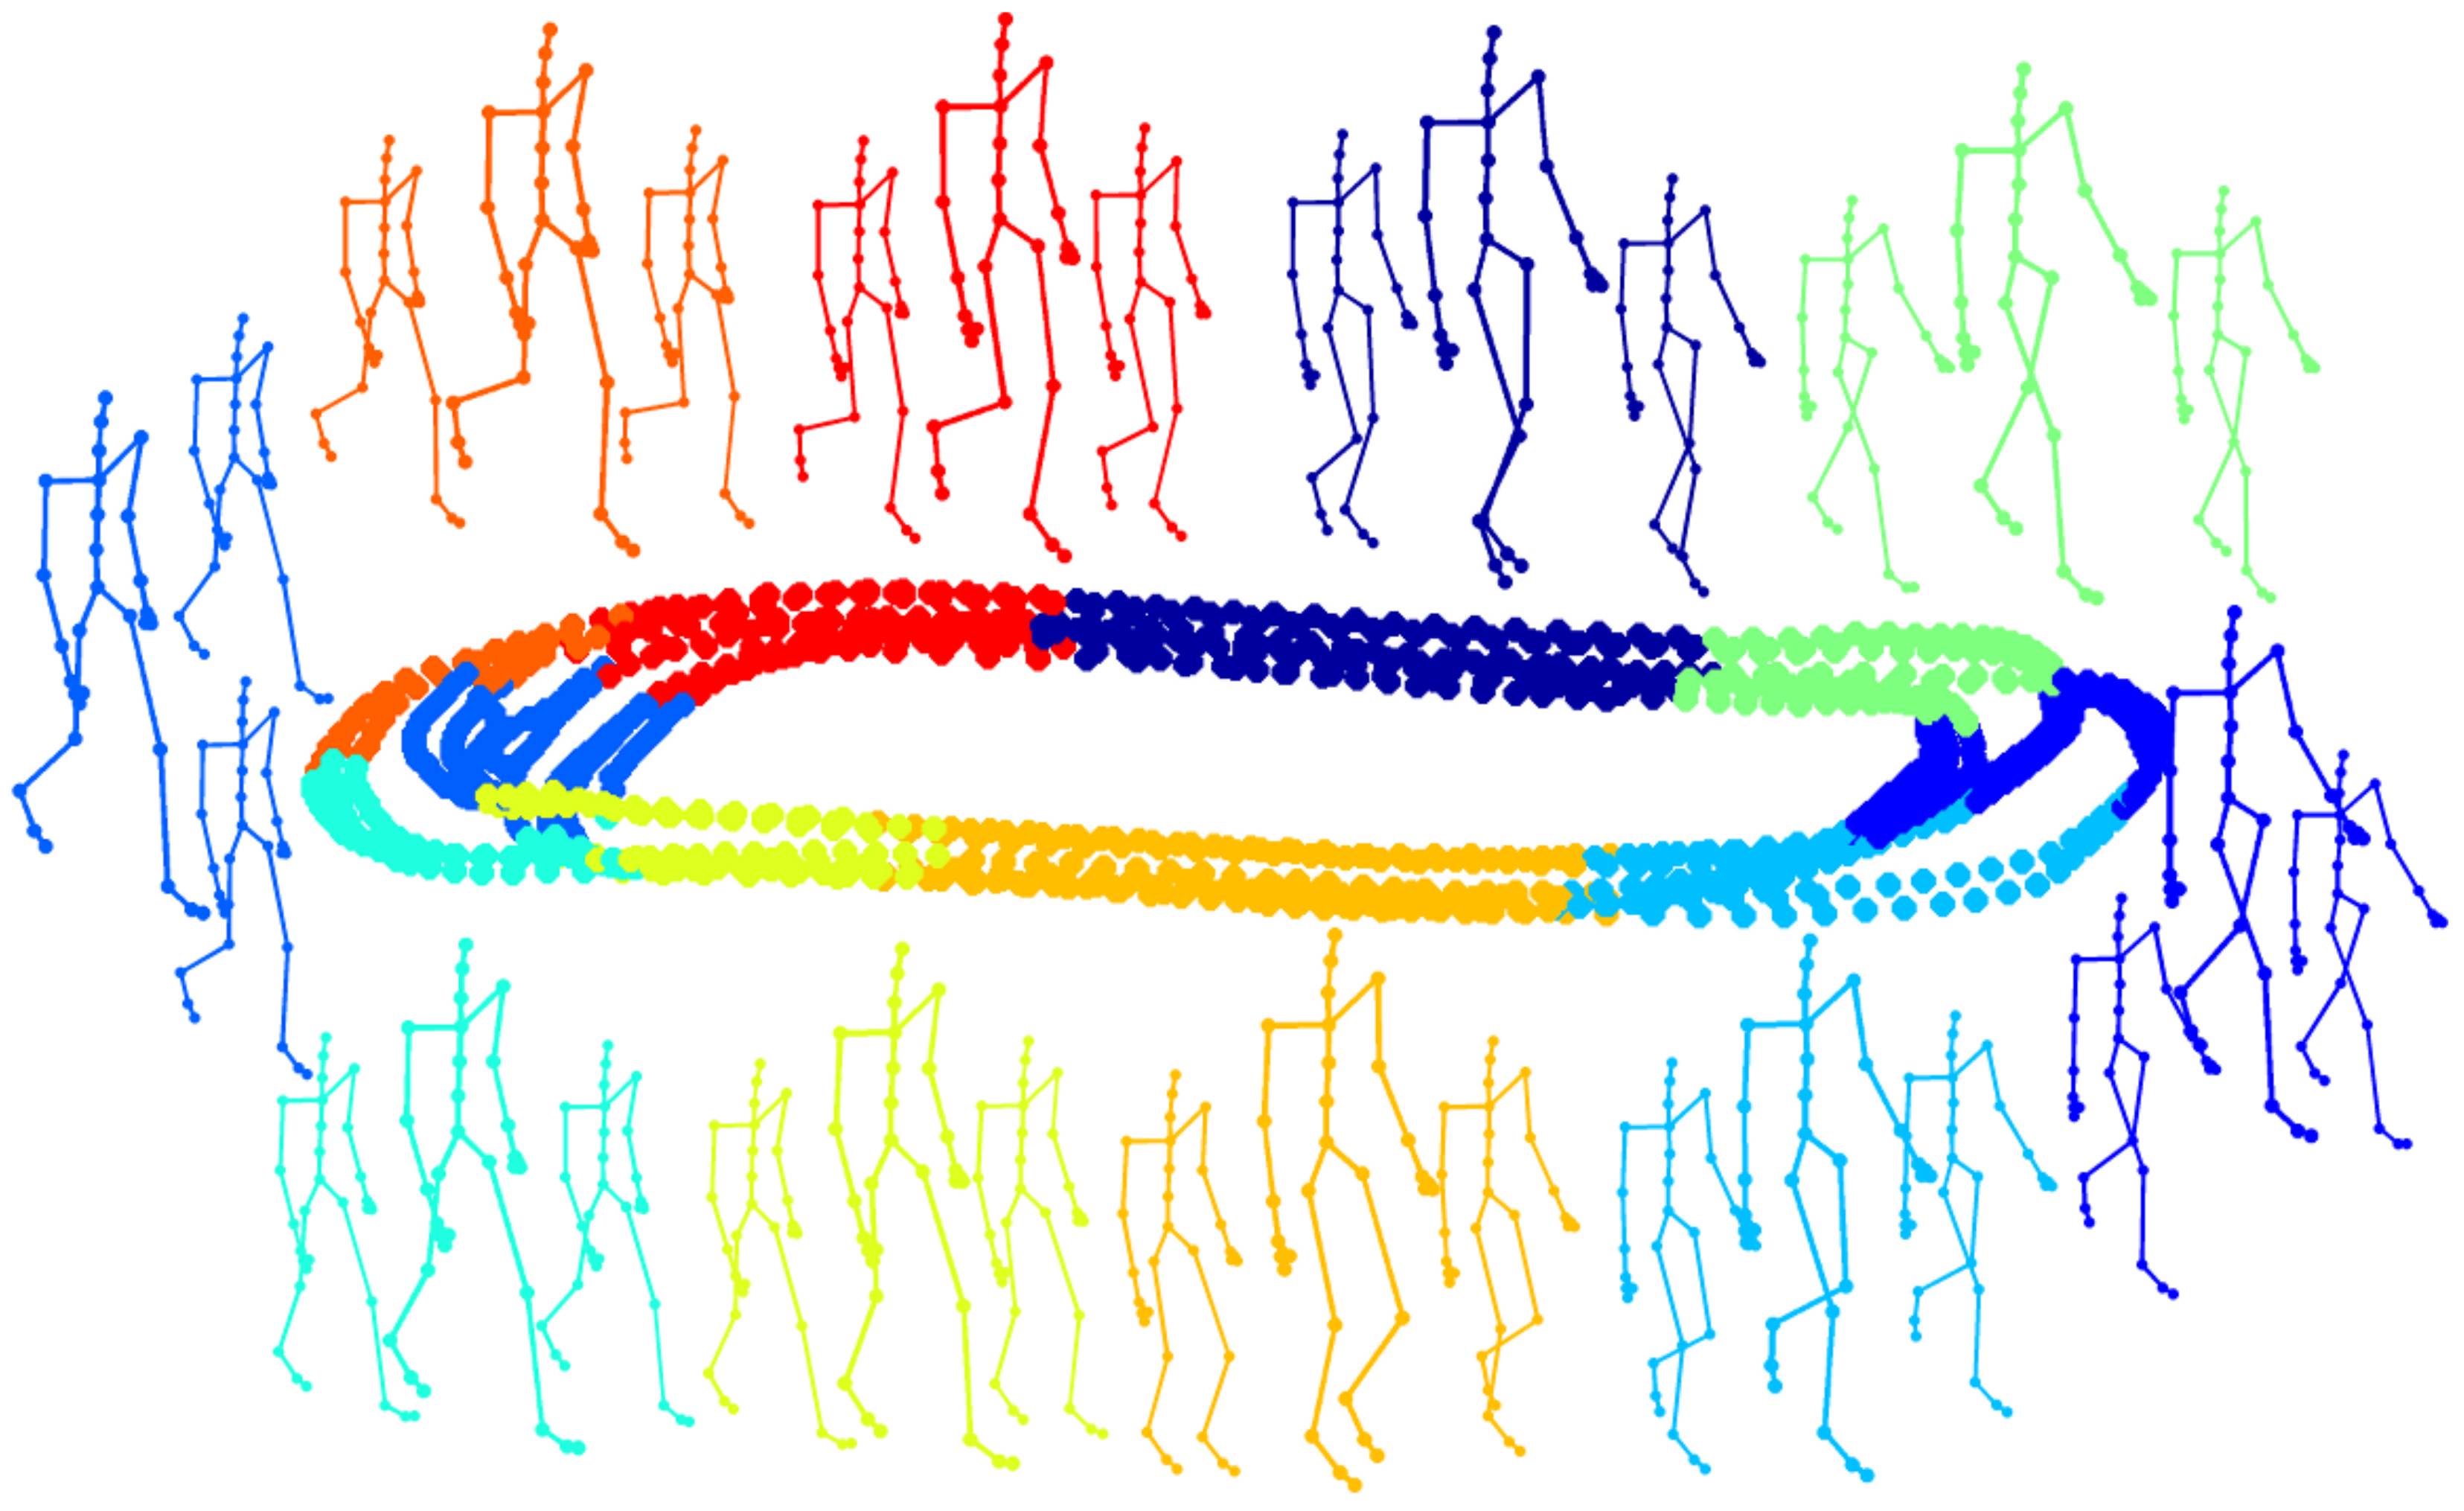
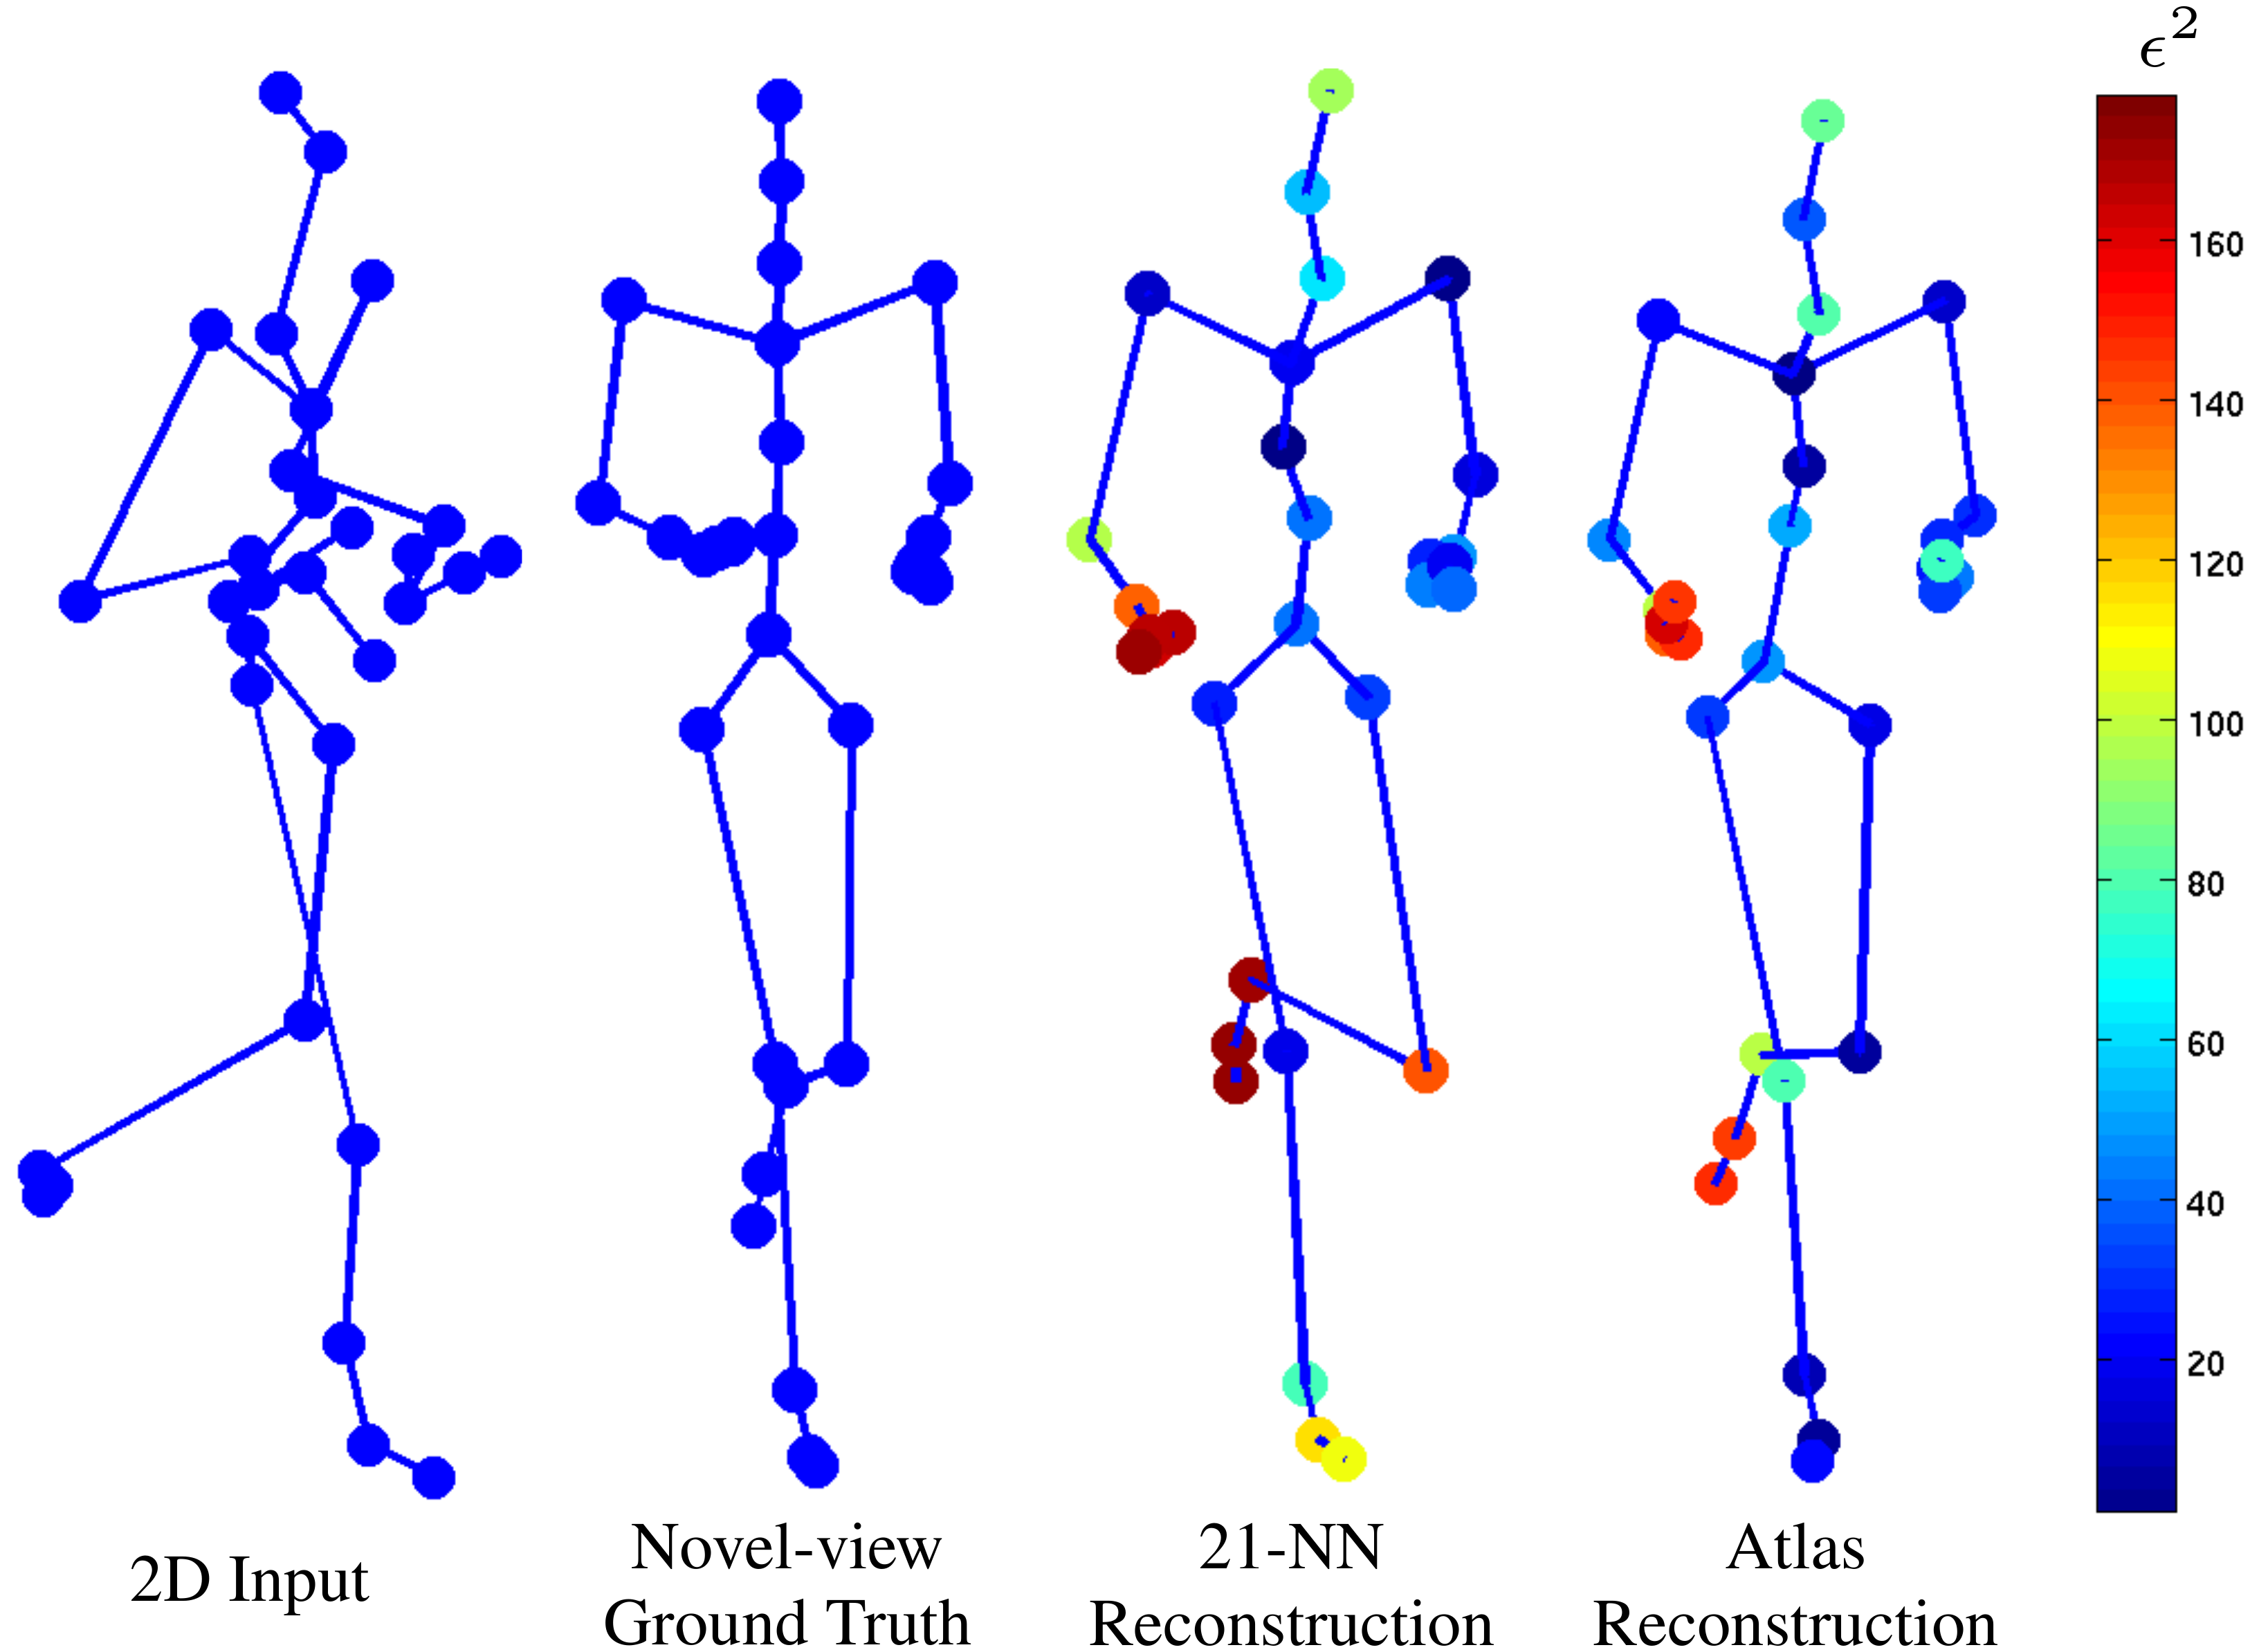
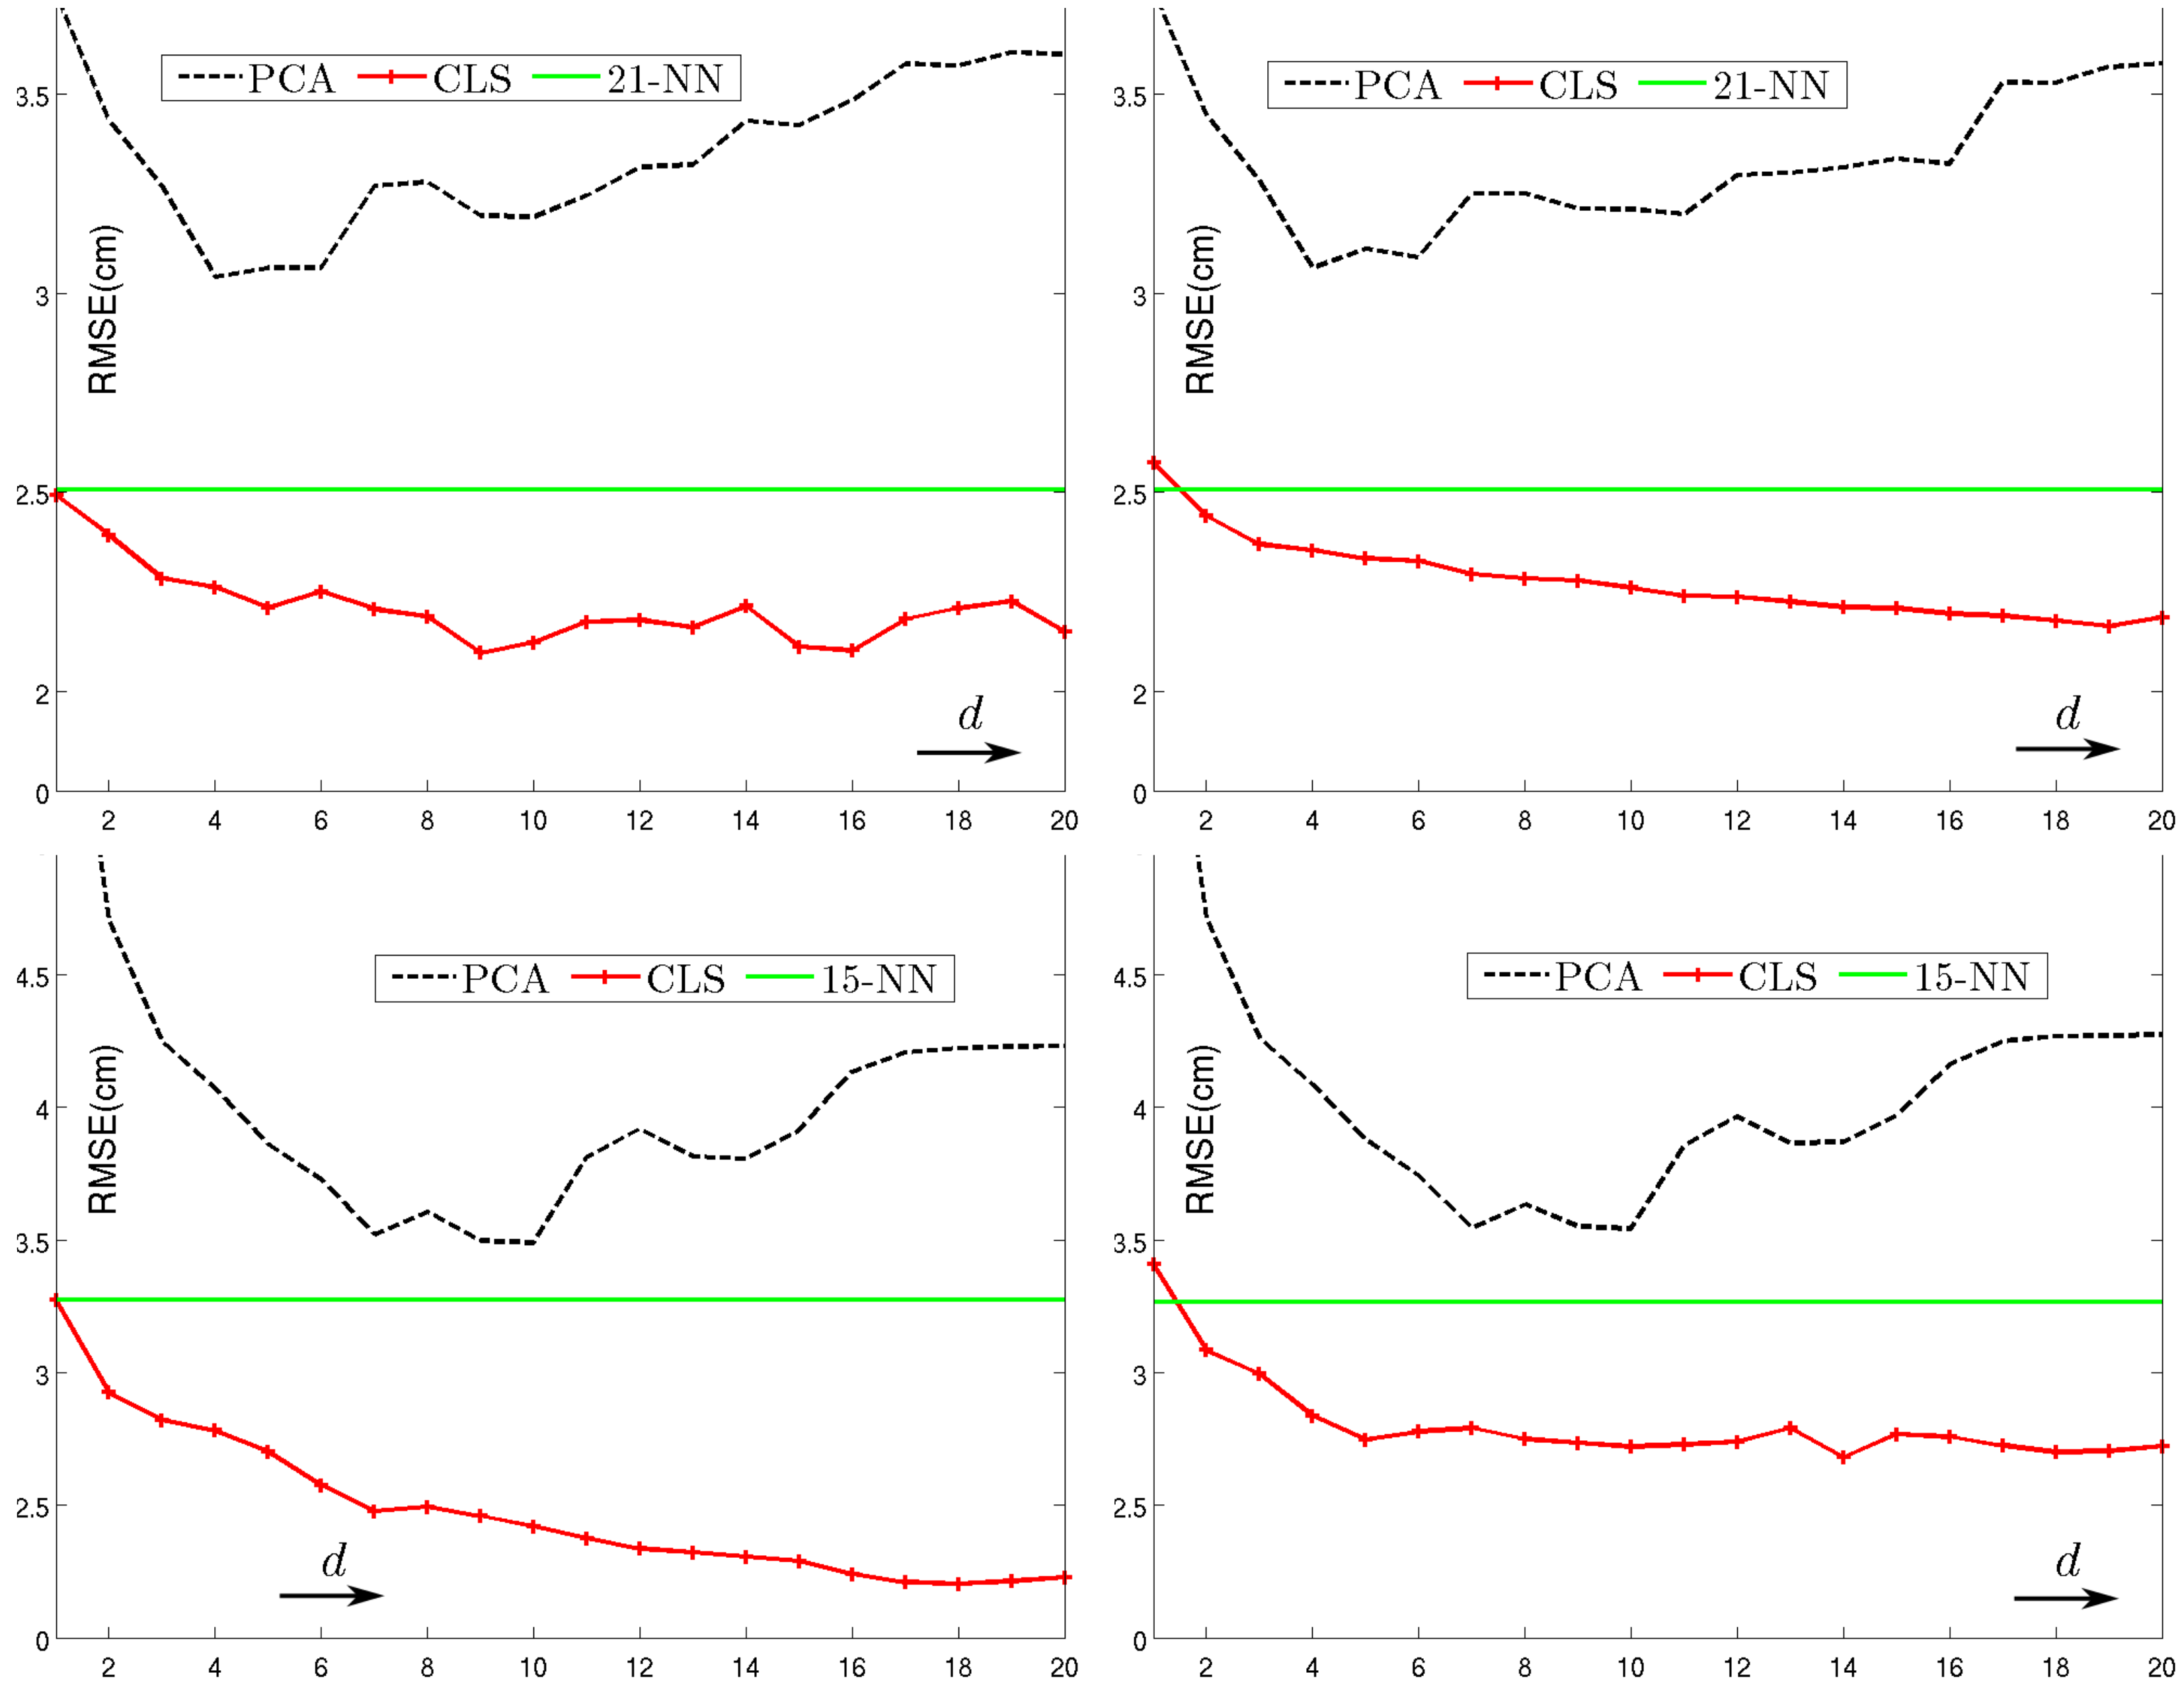
Left: The manifold of a gait cycle in the embedding space. Each colour indicates a different chart. Large stick-men represent the mean shape, while the small are ± one standard deviation along the principal component. Middle: Reconstruction of CMU running sequence with σ = 3cm Gaussian noise added to both the image reconstructed and the training data. The reconstructions of 21-NN and Atlas have aver- age RMS reconstruction error ( ) of 5cm and 3.74cm respectively. Marker colours are based on squared reconstruction error. Right: CMU average RMS reconstruction error for manifold dimensionality 1 to 20. Top row: dataset I walking sequences and bottom row: dataset II walking and running sequences. Left column shows 0cm noise case and right column 2cm noise.


Learning a Manifold as an Atlas*
Nikolaos Pitelis, Chris Russell, Lourdes Agapito,IEEE Conference in Computer Vision and Pattern Recognition (CVPR 2013), Portland, OR, USA, June 2013. pp 1642-1649.
[PDF][Supplementary Material PDF][Poster][IEEExplore][BibTeX]