

Figure 1: Volume changes of enhancing lesions for 15 patients after applying transformation from 5 different non-rigid registration schemes. It can be observed that increasing the distance between control points reduces the amount of volume change.
Figure 2:This figure illustrates the coupling of control points in 2D. (a) Initial distribution of control points over an artifical image. (b) Effects on the image for a global rotation and a random displacement of the control points. The deformed grid shows the displacement of the grid through the control points. Note that the deformed grid will not go through the control points, since the interpolation is achieved via approximating B-splines. (c) The area within the box shown in (a) can be made to preserve volume by forcing the displacement of all control points which influence this area to be the same.
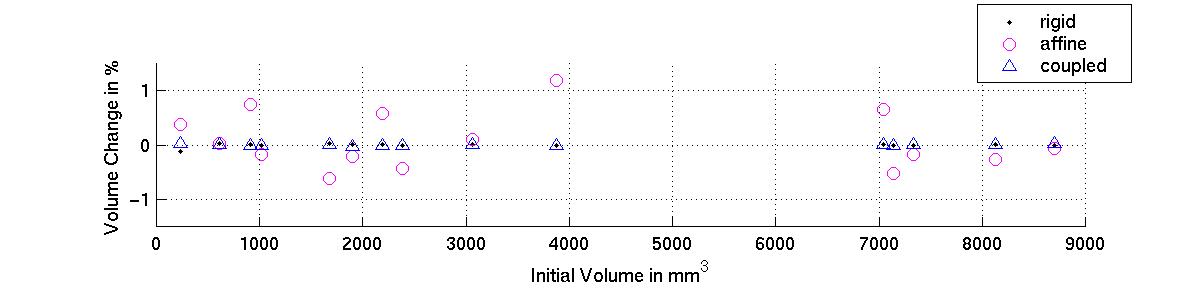
Figure 3: Volume changes of enhancing lesions for 15 patients after applying transformation from rigid, affine and non-rigid registrations with coupled control points. The volume changes observed for the rigid registration indicate the measurement errors, since rigid registration preserves volume by definition.
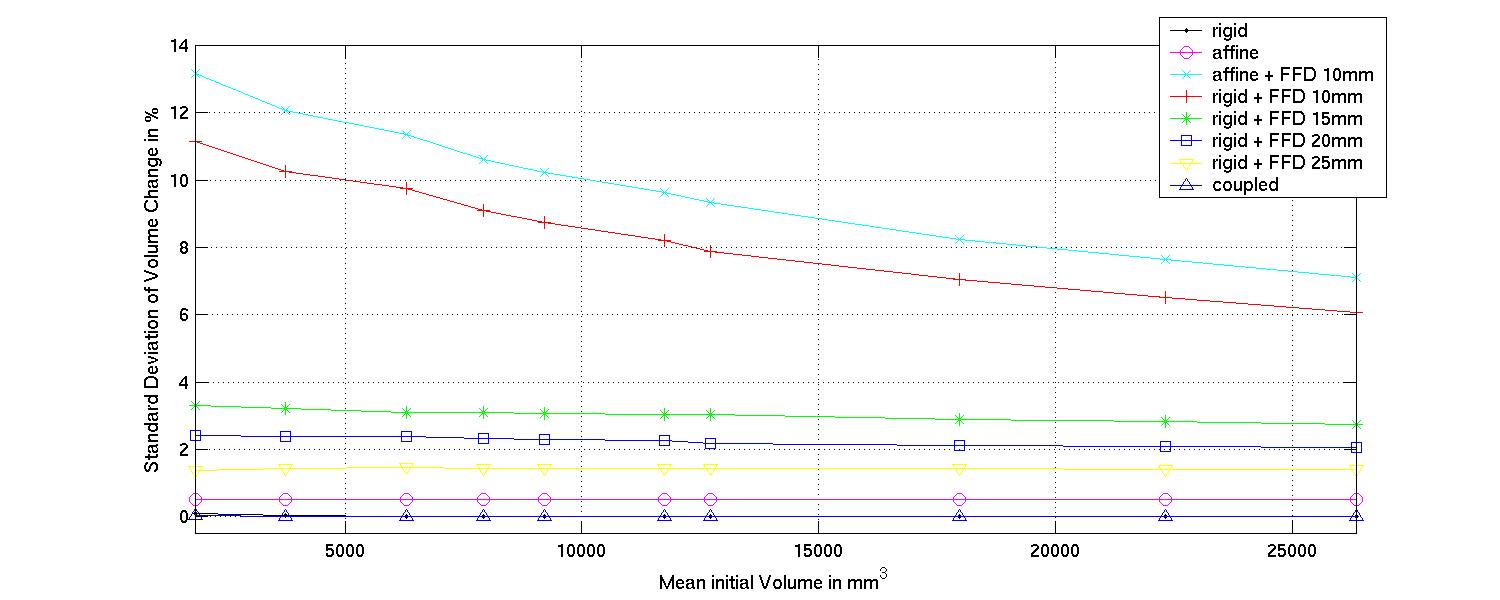
Figure 4:Influnce of lesion region definition. This shows the average standard deviation of volume change when the lesions were expanded. The initial ranking of the different registration remains the same, even as the areas are expanded. This indicates that the result is not very sensitive on the initial definition of the lesion region.


Figure 5: g1p4i.left, ROW1: a) pre-contrast image; (b) post-contrast images and transformed post-contrast images after (c) rigid registration, (d) non-rigid registration with control point spacing of 10mm, (e) non-rigid registration with control point spacing of 25mm and (f) non-rigid registration with coupled control points within an extended region of the lesion; ROW2: difference images after subtracting the pre-contrast image from the images in ROW1. ROW3: zoomed ROW1; ROW4: zoomed ROW2; ROW5: deformed tumour mask; Volume Change are (c) 0.00% (d) -3.51% (e) 0.31% (f) 0.00%


Figure 6: g1p14i.left, same sequence; Volume Change are (c) 0.00% (d) -16.83% (e) -1.95% (f) 0.00%