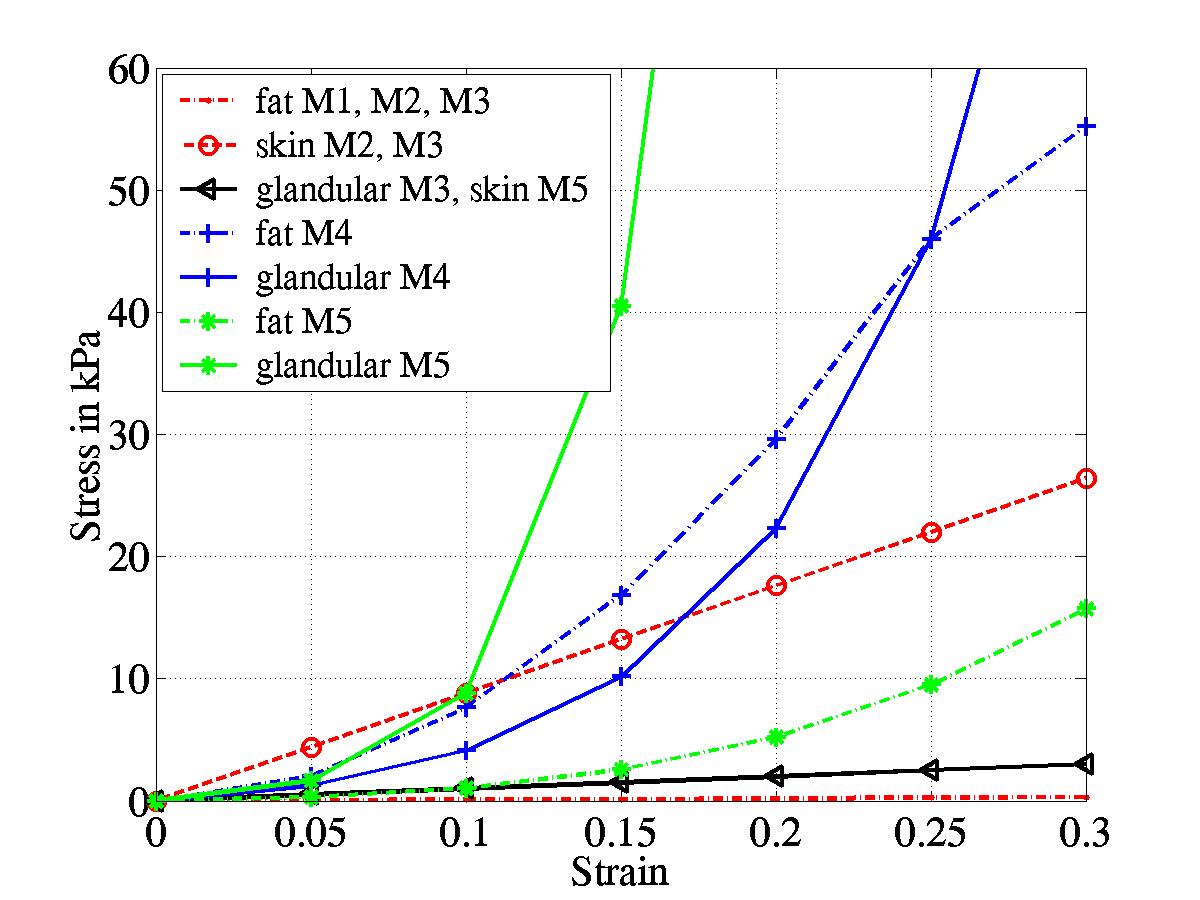
 Figure 1: Strain-stress relationship of fatty, glandular tissue
and skin for tested material models
M1 to M5.
Figure 1: Strain-stress relationship of fatty, glandular tissue
and skin for tested material models
M1 to M5.
The ability of the biomechanical breast models to predict breast deformations was assessed in [8] for five material models (Figure 1), five Poisson's ratios (0.499, 0.495, 0.45, 0.4, 0.3) and four boundary conditions (Figure 4).
Figure 1: Strain-stress relationship of fatty, glandular tissue
and skin for tested material models
M1 to M5.
MR images of a volunteer's breast were obtained before and after the breast was compressed by 15mm in a MR breast fixation device (Figure 2a). The 3D image of the compressed breast was registered to the 3D image of the uncompressed breast to obtain optimal surface boundary conditions (Figure 2b).
(a) (b)
(b)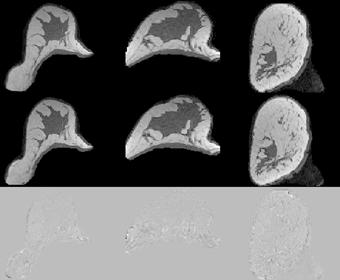 Figure 2: Axial, sagittal and coronal 2D example slices of
a volunteer's breast. (a) Original images with (top)
compressed breast, (middle) uncompressed breast (bottom) difference
image (middle-top). (b) After registering the compressed breast to
the uncompressed breast (top) registered compressed breast,
(middle) original uncompressed breast (bottom) difference image
(middle-top).
Figure 2: Axial, sagittal and coronal 2D example slices of
a volunteer's breast. (a) Original images with (top)
compressed breast, (middle) uncompressed breast (bottom) difference
image (middle-top). (b) After registering the compressed breast to
the uncompressed breast (top) registered compressed breast,
(middle) original uncompressed breast (bottom) difference image
(middle-top).
The breast was manually segmented into fatty and glandular tissue using ANALYZE. The outside surface of the breast was triangulated via vtk and meshed into 10-noded tetrahedral elements with the ANSYS FEM package. Each mesh element was labeled with the appropriate material property in accordance with the image segmentation. 3D surface displacements as determined by the 3D non-rigid registration were applied and a solution was obtained using the ANSYS FEM package (Figure 3).
(a)
 (b)
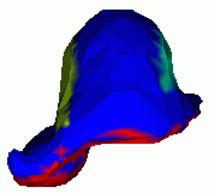
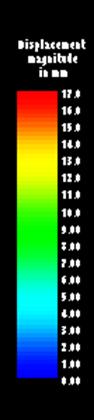
(b) Figure 3: Animation of applied displacement (a) on breast
surface and (b) at a cut through the mesh. The magnitude of the
displacement is displayed in colour.
Figure 3: Animation of applied displacement (a) on breast
surface and (b) at a cut through the mesh. The magnitude of the
displacement is displayed in colour.
|
Boundary conditions were applied on the whole breast surface
(BC1) or on the deep,
medial and lateral side of the breast (BC2) as shown in Figure 4.
In BC3 and BC4 it was assumed that the deep side and the deep and
medial side had not moved. Figure 4 (right): Deep (red), lateral (yellow) and medial (green) part of the breast used for boundary conditions BC2 to BC4. |
|
(a) (b)
(b)
Figure 5:
Illustration of corresponding landmark positions (at center of blue
cross) for
(a) the uncompressed and (b) the compressed breast.
RESULTS
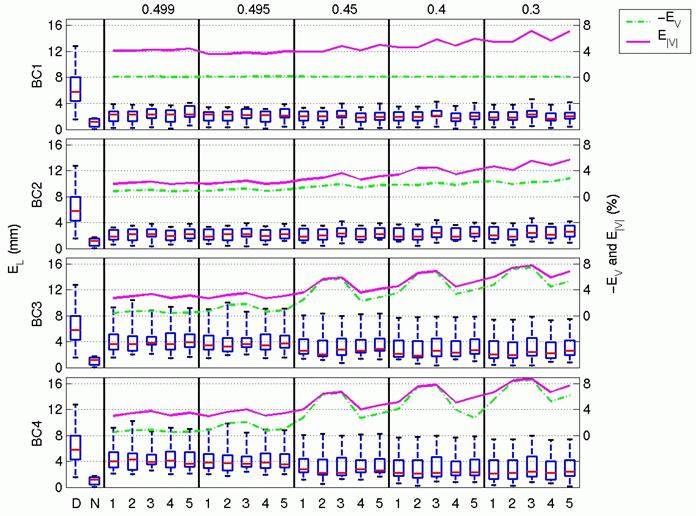
Figure 6: The boxplots show the distribution of the
Euclidean distance for the 12 corresponding landmarks (EL).
Tests were conducted for four boundary
conditions (row: BC1 to BC4), five Poisson's ratios (main columns:
0.499, 0.495, 0.45, 0.4, 0.3) and five material models (minor columns
1 to 5 in main columns). The first two minor columns show EL with
respect to the original landmark positions (labeled with 'D') and
after the 3D non-rigid registration ('N').
The horizontal lines of the box in the boxplots represent the
lower quartile, median and upper quartile
value. The lines extending from each box cover the full range of
EL. The dashed horizontal lines display the negative value of the
global volume change ( -EV) in %. The solid horizontal lines show the
amount of local volume change measured by E|V| in %.
CONCLUSIONS
The biomechanical breast models predicted internal landmark positions with an accuracy of 2.0mm to 2.3mm for all material models at realistic boundary conditions (BC2) on average. Assuming no patient movement at the deep or the medial side introduced incorrect boundary conditions, that caused average errors to increase beyond 4.0mm at high Poisson's ratios. Although the average error decreased to about 2.8mm in these cases for low Poisson's ratios, errors remained high close to the incorrect boundary conditions. None of the tested material properties was obviously better.
Publications: