
Land-Line.Plus digital map data is digitised from Ordnance Survey Large Scales maps and surveys which show the accurately surveyed positions of the natural and man-made features of the topography.
The data includes
outlines and divisions of buildings, land parcel boundaries,
road kerbs, rivers and water features. It is derived from three
source scales of mapping: Urban
(1:1,250 scale) - major towns and cities; Rural
(1:2,500 scale) - smaller towns, villages and developed rural
areas; Moorland
(1:10,000 scale) - mountain and moorland areas.
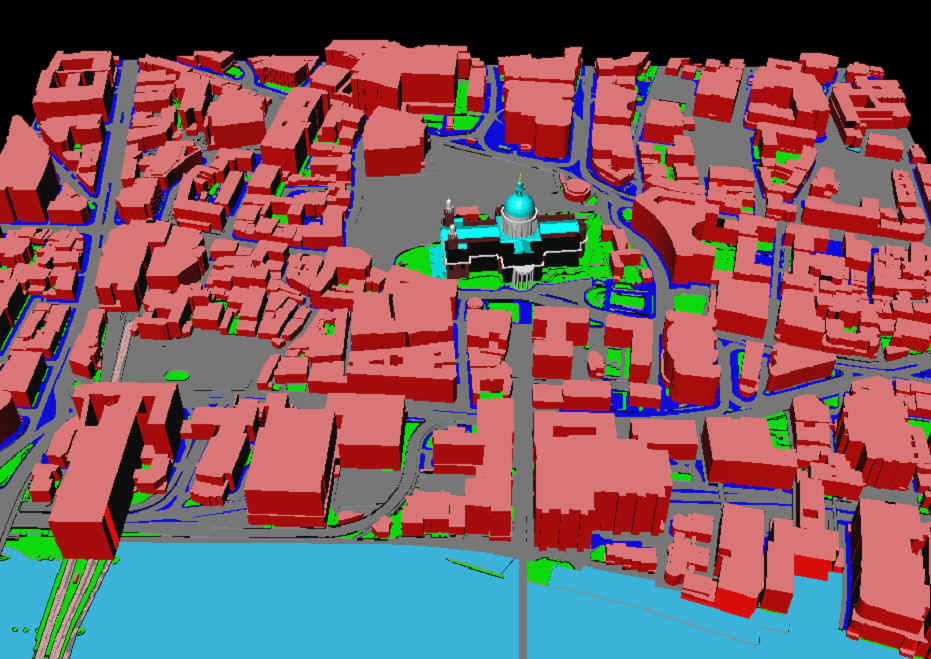
Buildings, streets, pavements, water and parks are recognised. The height values of the buildings are proportional to their area

A more detailed model can be imported easily using the global coordinates of the Ordnance Survey
 For each point, grey values give the scalar quantity of
pollution
For each point, grey values give the scalar quantity of
pollution
![]() Position of the static stations that give the input values
to construct the model
Position of the static stations that give the input values
to construct the model
![]() The height of the blue lines gives the confidence of the
extrapolated value
The height of the blue lines gives the confidence of the
extrapolated value
