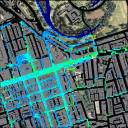
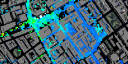
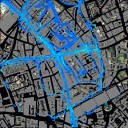
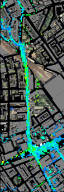
Below is a map of all carbon monoxide data collected between April 2004 and August 2005, centred on areas around Marylebone Road, Camden, UCL and Clerkenwell. The data shows the mean of all the data collected on a 10 metre grid. Click on one of the tiles to show a 3D representation in VRML (approx 300KB, requires VRML plugin e.g. Cortona).
|
|
|||||||||
|
| |
|
|
|
||||||
|
|
|
|
|
|
|
||||
|
|
|
|
|
|
|
|
|
|
|
|
|
|
|
|
|
|
|
|
|
|
|
|
|
|
|||||||
|
NOTE: Data for Marylebone Road and Camden was collected between April and May 2004, while data for Clerkenwell was collected between November 2004 and February 2005. Data around the UCL area contains parts of the Marylebone Road, Camden and Clerkenwell studies, together with additonal data collected between May 2005 and August 2005. The different times of year account for the different mean CO levels between the east (Marylebone Road) and west (Clerkenwell) sides of the map.
| Colour | White | |||||||||
|---|---|---|---|---|---|---|---|---|---|---|
| CO (ppm) | 0 | 1.25 | 2.5 | 3.75 | 5.0 | above 5.0 |