For the final runs on the afternoon of Friday 21 May, there were only two walkers available, but three packs of equipment. As an additional experiment to attempt to measure the difference between a kerbside sensor and a roadside sensor, the green rucksack was loaded with the equipment from both the green and red packs.
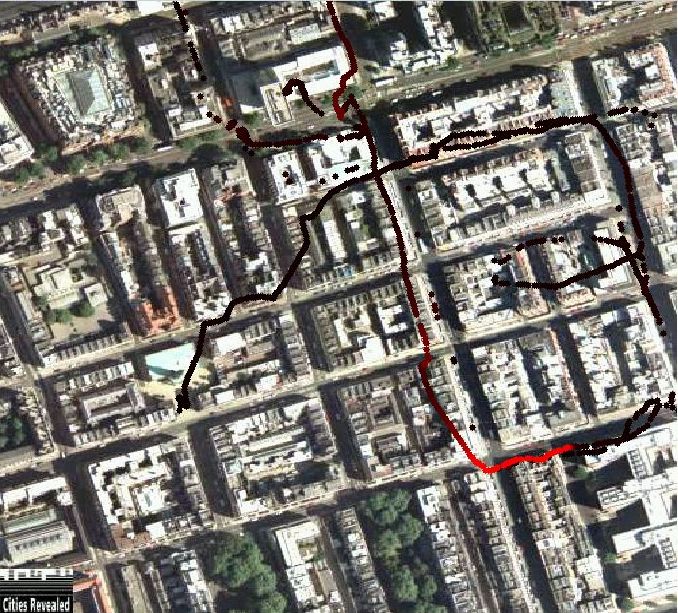
The green PDA with the green HAICOM GPS was used with the external aerial and the green ICOM on the left of the pack. The red labelled white box GPS was used with the red PDA, the extension aerial and the red ICOM on the right of the pack. Due to problems getting a GPS fix, the pack was taken to St. Mary's church spire on the junction with Crawford Street and Wyndham Street, where there is the clearest view of the sky. Once the GPS obtained a fix, the pack was walked around the cycle route twice, as can be seen on the trace from the red GPS. Unfortunately, the green GPS was only able to obtain isolated position fixes and does not contain enough information for a GPS comparison.
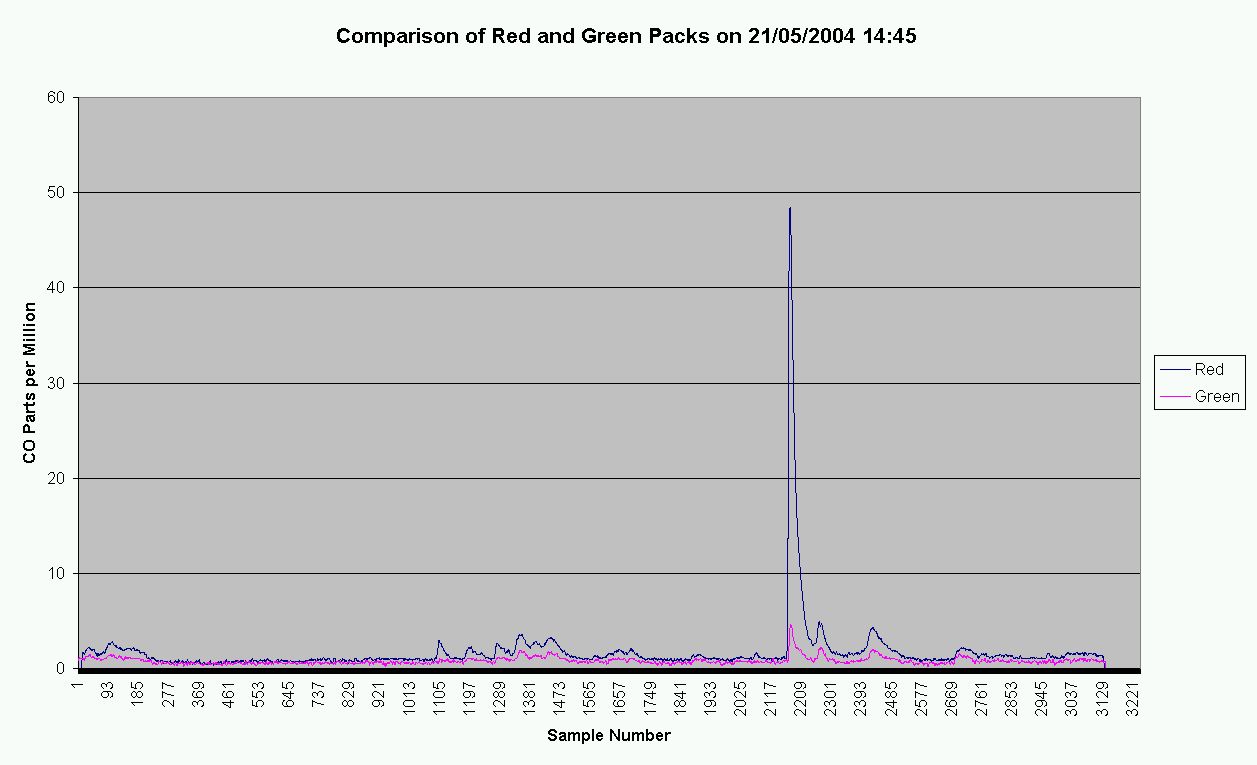
Looking at the raw data for the Red pack, there is a CO peak of 48.4ppm at the corner of Dorset Street and Gloucester Place. At this point on the route, the pack is heading left along Dorset Street, about to head up Gloucester Place, relative to the map below. This means that the walker is on the south side of Dorset Street, walking in the direction of traffic with the Green ICOM towards the pavement and the Red ICOM towards the road. The route then involves crossing over Gloucester Place, which is one way, so the green ICOM on the left is pointing straight towards four lanes of cars waiting at the traffic lights. The walker then turns right to continue north up Gloucester Place, but has to cross Montagu Place at another set of lights with the green ICOM pointing at the traffic on Montagu Place and the red ICOM next to the heavy traffic on Gloucester Place.
| Red Route |
|---|
|
The red log file was started at 14:43:27, while the green log file was started at 14:44:39. By plotting the ICOM CO readings (corrected by subtracting the base value) for both devices, the high reading of 48.4ppm in the red log can be checked against the same time index in the green log. The graph below is a plot of the data logged from the ICOM sensors in the green and red packs, corrected for the difference in start time. Characteristic peaks in the data are clearly evident, giving good time correspondence between the two sensors, but with the green sensor consistently reading lower than the red one. This can be explained by the fact the the green sensor on the left is almost always kerbside due to the walking route. The only place where the green sensor is roadside is walking south down Baker Street.
NOTE The logs from both sensors show the sensor temperatures to be around 20 Celsius, while both units' batteries are about 12.3 volts. Neither value is outside the normal operating range.